
1. Revenue Trajectory and Operational Scale
In the capital-intensive agrochemical and fertilizer sector, top-line growth is the foundational engine for achieving the economies of scale necessary to offset high fixed costs and commodity price volatility. Over the last decade, Chambal Fertilisers & Chemicals Ltd has undergone a significant expansion of its operational scale, navigating a transition from a mid-tier producer to a dominant industrial entity. Understanding this trajectory is vital for retail investors, as it demonstrates the company’s capacity to capture market share and manage the normalization of top-line revenue following periods of extreme commodity price volatility.
Decade Revenue and Expense Overview (Mar-16 to Mar-25)
| Fiscal Year | Sales (INR Cr) | Expenses (INR Cr) |
| Mar-16 | 9,007.95 | 8,354.17 |
| Mar-17 | 7,553.45 | 6,794.57 |
| Mar-18 | 7,541.02 | 6,730.43 |
| Mar-19 | 10,094.52 | 8,894.49 |
| Mar-20 | 12,205.95 | 10,280.64 |
| Mar-21 | 12,719.01 | 10,249.34 |
| Mar-22 | 16,068.83 | 13,803.69 |
| Mar-23 | 27,772.81 | 25,950.66 |
| Mar-24 | 17,966.41 | 15,919.40 |
| Mar-25 (Proj) | 16,646.20 | 14,145.13 |
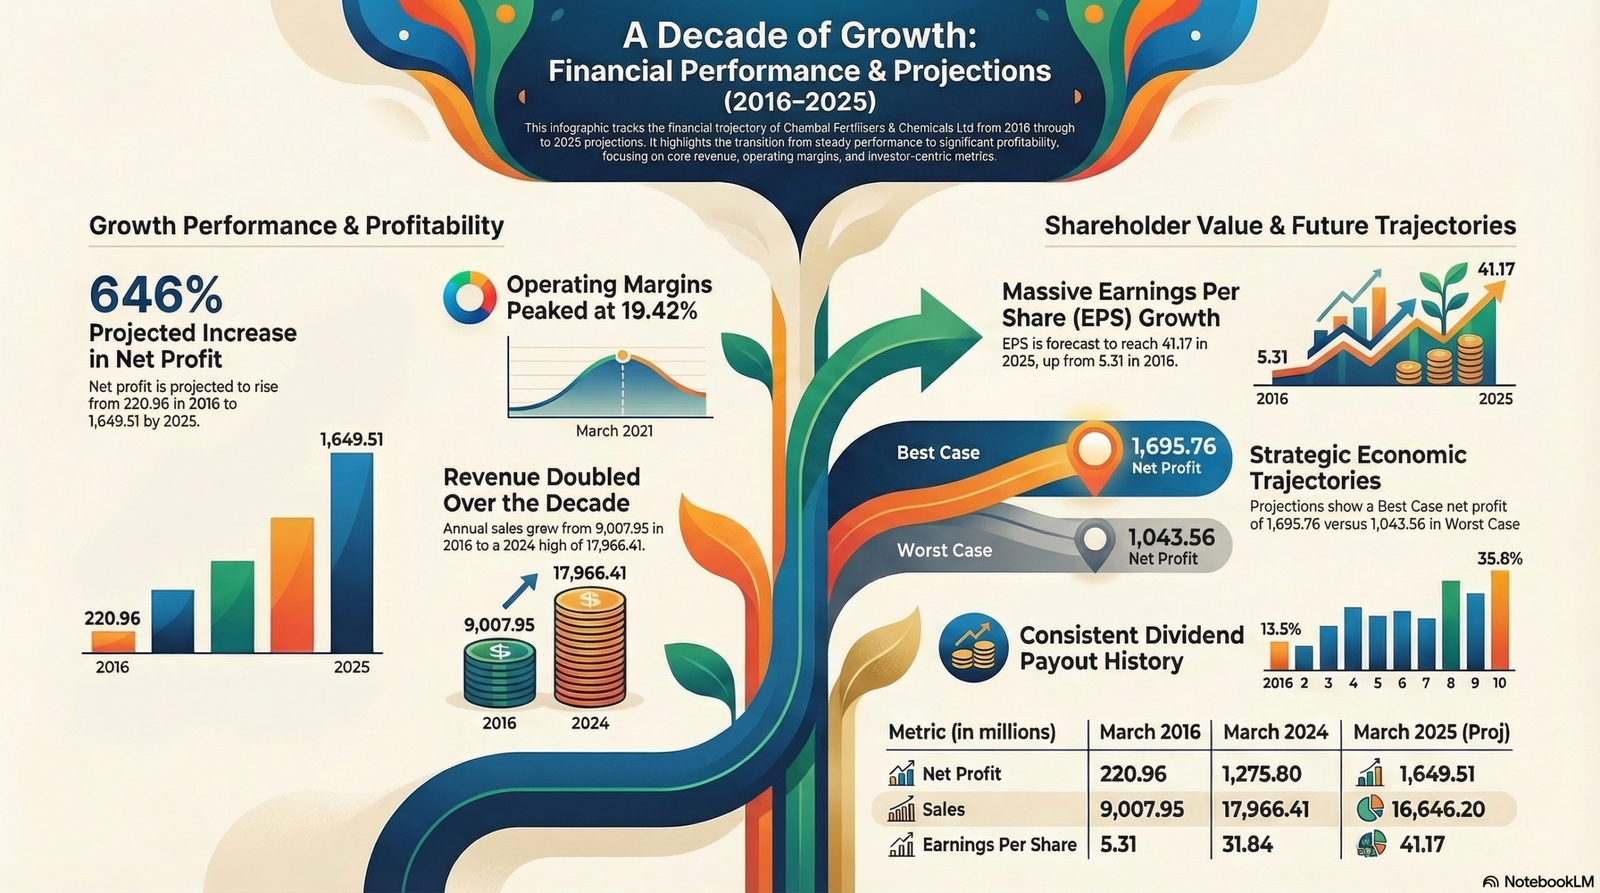
The “So What?” for Investors: The raw scale of revenue expansion reached a dramatic peak in Mar-23 at 27,772.81, nearly tripling the Mar-16 volume of 9,007.95. However, the projected Mar-25 figure of 16,646.20 indicates a purposeful contraction toward a sustainable baseline. The critical takeaway here is the management of the cost structure: while revenue is projected to stabilize, the anticipated reduction in expenses to 14,145.13 suggests a defensive posturing aimed at protecting fiscal sustainability even as top-line volume recedes from its historical highs.
This disciplined approach to operational scaling directly influences the company’s ability to maintain efficiency through varying market cycles.
——————————————————————————–
2. Operating Profitability and Margin Analysis
Operating Profit Margin (OPM) serves as the primary metric for assessing a company’s competitive moat and its ability to absorb input cost shocks. For the retail investor, OPM acts as a barometer for operational efficiency; a superior margin profile suggests that a company possesses either pricing power or a highly optimized supply chain that can withstand the cyclicality inherent in the fertilizer industry.
Evolution of Operating Profit and OPM
- Historical Baseline (Mar-16): The decade began with an OPM of 7.26% on an Operating Profit of 653.78.
- Peak Operational Efficiency (Mar-21): The organization achieved a decade-high OPM of 19.42%, translating to an Operating Profit of 2,469.67.
- Projected Forward Efficiency (Mar-25): Conservative projections place the OPM at 15.02%, with an Operating Profit of 2,501.07, indicating a significantly higher floor than the 2016 levels.
The “So What?” for Investors: The Mar-23 fiscal period presents a critical red flag synthesis for any discerning analyst. During this year, Sales skyrocketed by approximately 72% (from 16,068.83 to 27,772.81), yet the OPM collapsed to 6.56%. Consequently, Net Profit plummeted from ,1565.98 in Mar-22 to just 1,034.22 in Mar-23. This illustrates the danger of “unprofitable growth” where record-breaking revenue was completely eroded by a disproportionate 88% surge in expenses. The projected recovery to a 15.02% OPM by Mar-25 is an essential prerequisite for stabilizing shareholder value.
Operational efficiency is the engine, but net earnings are the destination for retail wealth creation.
——————————————————————————–
3. Net Earnings and Shareholder Value Creation
Net Profit and Earnings Per Share (EPS) are the ultimate markers of management’s fiduciary success. While revenue and margins describe the business operations, these “bottom-line” figures quantify the actual per-share wealth generated for the retail owner after all obligations—including taxes, interest, and depreciation—have been settled.
Structural Earnings Expansion The decade has seen a remarkable compounding of total earnings. Net Profit rose from a baseline of 220.96 in Mar-16 to a Trailing figure of 1,914.49. It is imperative to note that the Trailing Net Profit currently represents the absolute peak in the dataset, significantly outperforming the conservative Mar-25 projection of 1,649.51. This suggests that the company’s current earnings momentum is stronger than forward-looking estimates might imply.
EPS Trend and Per-Share Wealth
- Mar-16 EPS: 5.31
- Mar-25 Projected EPS: 41.17
- Structural Jump: Between Mar-19 (14.18) and Mar-21 (39.76), the company underwent a structural earnings expansion that fundamentally reset the value of each share.
The “So What?” for Investors: The trajectory from an EPS of 5.31 to a projected 41.17 represents a near eight-fold increase in the earning power of a single share over ten years. This isn’t just growth; it is a fundamental shift in the company’s ability to generate wealth. The current Trailing EPS of 47.78 underscores that the organization is currently operating at its highest level of profitability in a decade, providing a substantial cushion for future dividend distributions.
The translation of these earnings into market value depends heavily on how investors price this performance.
——————————————————————————–
4. Dividend Policy and Market Valuation Metrics
Determining an attractive entry point requires a balanced view of Price-to-Earnings (P/E) multiples and dividend payout ratios. These metrics reveal whether the market is overpaying for growth and how much of that growth is being shared with the retail investor as tangible cash flow.
Investor Metrics Comparison
| Metric | Mar-16 | Mar-20 | Mar-25 (Projected) |
| Share Price | 54.90 | 108.45 | 625.50 |
| P/E Ratio | 10.34 | 3.68 | 15.19 |
| Dividend Payout % | 35.79% | 13.58% | 24.29% |
Valuation Analysis and The “So What?”: The Mar-25 projected P/E of 15.19 marks a significant premium compared to the Mar-20 low of 3.68. More importantly, when compared against the decade-average P/E of approximately 11.0, the current valuation of 15.19 suggests the stock is entering “expensive” territory by historical standards. While the company’s earnings floor has risen, retail investors must weigh the current share price against this historical norm. Paying 15x earnings for a cyclical commodity player requires high confidence that the Mar-25 “Best Case” scenarios will be realized.
Prudent investing requires the analyst to look beyond the current price and stress-test the investment against varied economic trajectories.
——————————————————————————–
5. Strategic Growth Projections: Best vs. Worst Case Scenarios
An essential component of equity research is stress-testing an investment against differing economic environments to establish a “Safety Margin.”
Economic Trajectory Comparison
| Best Case Scenario | Worst Case Scenario |
| Sales: 20,457.36 | Sales: 16,888.34 |
| EPS: 42.33 | EPS: 26.05 |
| Share Price: 482.05 | Share Price: 234.22 |
The “So What?” for Investors: The “Worst Case” scenario provides a critical insight into downside protection. While a share price of 234.22 would represent a significant correction from current highs, it is still more than double the Mar-20 entry price of 108.45. This indicates that even under stressed conditions, the company’s structural improvements over the last decade have created a much higher floor for value. Retail investors should use these figures to set realistic stop-losses; if the price breaches the 234.22 level, it likely signals a deviation from the established fiscal stability of the organization.
——————————————————————————–
6. Final Investor Takeaway
A decade-long retrospective of Chambal Fertilisers & Chemicals Ltd reveals an organization that has successfully managed a transition to high-value earnings. Despite the massive margin compression seen in 2023, the company has demonstrated a resilient ability to recapture operational efficiency and scale its bottom line.
Critical Takeaways for Retail Investors
- Resilient Profitability: The recovery from a 6.56% OPM in Mar-23 to a projected 15.02% in Mar-25 showcases management’s ability to correct course after input cost shocks.
- Strong Shareholder Returns: The Trailing Net Profit of 1,914.49 is the highest in the company’s history, suggesting that recent earnings power is robust and exceeds conservative forward estimates.
- Valuation Sensitivity: With a projected P/E of 15.19 against a decade average of ~11.0, the stock is currently priced for perfection. Investors should monitor for any deviation from projected expense management, which remains the company’s primary risk factor.
Final Summary Chambal Fertilisers presents a profile of a mature industrial leader with strong fiscal health and a proven ability to generate per-share wealth. While current valuations are historically high, the fundamental expansion of EPS from 5.31 to over 40.00 since 2016 provides a robust foundation for long-term value, provided the company maintains its current operational discipline.