1. Contextual Framework: The Governance Dichotomy
This strategic review dissects the high-stakes “Governance Dichotomy” currently defining Chambal Fertilisers & Chemicals Ltd. The company is operating in a polarized environment where external regulatory friction—manifesting as recurring tax penalties and fiscal volatility—collides with aggressive internal stake-building by promoter entities. For institutional stakeholders, this creates a complex risk-reward profile: the underlying stability of the Birla Group’s backing and the company’s recent achievement of debt-free status must be weighed against structural governance risks and a 25.85% share price decline over the last 12 months.
The core objective of this analysis is to evaluate whether recent promoter acquisitions signal an undervalued asset with high intrinsic potential or function as a compensatory mechanism designed to bolster market sentiment amidst rising structural risks. As the company navigates the 2026 fiscal period, deciphering these signals is critical for determining whether the current valuation represents a “floor” or a precursor to further liquidation risks.
The following sections analyze the specific regulatory challenges that have contributed to this atmosphere of uncertainty.
2. Regulatory Compliance Analysis: Dissecting “Aggressive Tax Accounting” Risks
In March 2026, the Income Tax Department issued a series of penalty orders against Chambal Fertilisers, totaling several crores across multiple assessment years. These actions suggest a pattern of “Aggressive Tax Accounting” wherein the company has historically utilized optimistic interpretations of revenue expenditures and accounting prudence that have failed to withstand regulatory scrutiny.
Income Tax Penalty Analysis (AY 2011-12)
| Issue Category | Amount | Original Claim Logic | Regulatory Disallowance Reason | Current Status / Resolution |
| River Construction | ₹96.86 Lakh | Construction of Parwan River anicut claimed as Revenue Expenditure to augment water supply. | Determined to be Capital in nature; provides long-term utility for manufacturing. | Eligible for depreciation from capitalization year; company contesting penalty. |
| Fertilizer Bonds | Included in above | Recognized diminution in value (FMV vs. Book Value) as a Prudence Loss. | Deduction only allowed in the year of actual sale, not upon recognition of value dip. | Deduction allowed in the year bonds were sold; company contesting penalty order. |
Beyond the AY 2011-12 order, the company received further penalties in early 2026 related to education cess claims, including orders for ₹1.35 crore and ₹58.28 lakh. While management asserts these have “no operational impact,” the cumulative signal points to persistent administrative friction. For institutional risk analysts, these recurring disputes indicate potential weaknesses in historical tax compliance frameworks, which may lead to continued fiscal outlays as the company pursues appeals.
Notably, promoter entities have chosen this period of high regulatory friction to execute aggressive open-market purchases, suggesting a conviction that outweighs these administrative hurdles.
3. Promoter Strategy: Deciphering the Stake-Building Surge
Promoter buying patterns often serve as a marker of internal valuation confidence that counters broader market sentiment. In March 2026, major entities within the Birla Group engaged in rapid acquisition activity, likely attempting to signal a “valuation floor” following a year of significant share price erosion.
Aggressive acquisition activity by CM Airtime Promotion LLP and Ganges Securities Limited includes:
- CM Airtime Promotion LLP: Executed three separate acquisitions in one week (March 4–9, 2026), rapidly increasing its stake from 0.412% to 0.502%.
- Ganges Securities Limited: Increased its holding to 0.61% via an open-market purchase of 118,000 shares on March 17, 2026.
- Internal Confidence Signal: These purchases reflect a strategic attempt to counter a 25.85% annual share price decline, effectively signaling that the promoter group views current prices as an accumulation opportunity despite the ongoing tax litigation.
However, this signal of confidence is significantly complicated by a rising trend in share pledging, which introduces a “Pledging Paradox” into the governance narrative.
4. The Pledging Paradox: Ownership Growth vs. Financial Encumbrance
A critical metric for institutional risk assessment is the level of promoter encumbrance. At Chambal Fertilisers, a paradoxical trend has emerged: while promoters are buying new shares in the open market, they are simultaneously increasing the percentage of their total stake pledged to lenders.
Evolution of Promoter Pledging (2025)
| Quarter Ending | Total Promoter Stake (%) | Percentage of Stake Pledged (%) | Change (bps) |
| March 2025 | 60.40% | 19.05% | – |
| June 2025 | 60.50% | 19.67% | +62 |
| September 2025 | 60.58% | 22.32% | +265 |
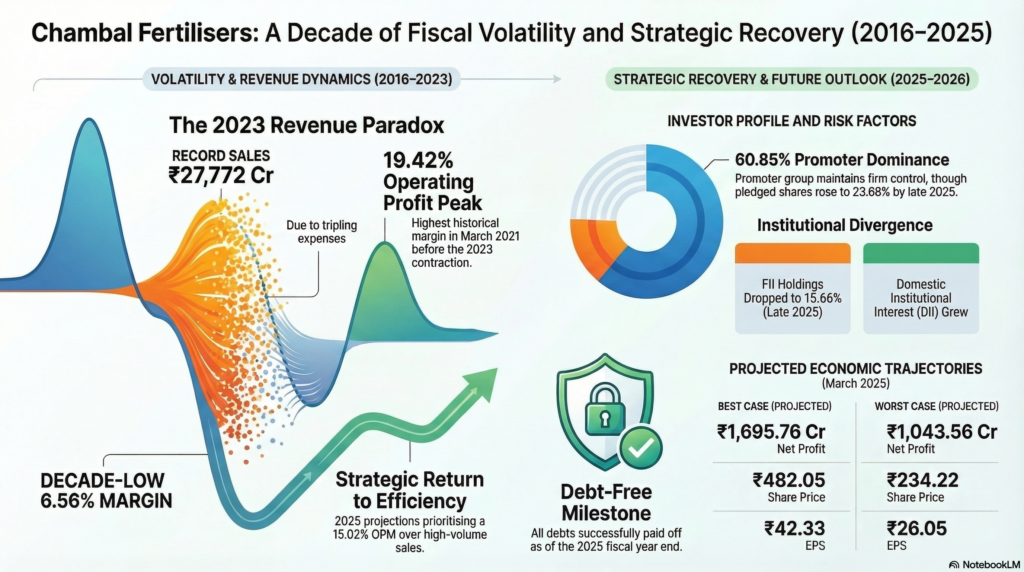
| December 2025 | 60.85% | 23.68% | +136 |
Strategic Risk Assessment: Debt-Funded Stake Building From a corporate governance perspective, the simultaneous rise in open-market buying and pledging suggests the possibility of debt-funded stake building. Promoters may be leveraging existing equity to fund the acquisition of new shares—a classic governance red flag. With nearly a quarter (23.68%) of the promoter stake now encumbered, minority shareholders face heightened risk; should market volatility trigger margin calls, the resulting pledge-related liquidations could lead to a self-reinforcing downward price spiral.
This internal financial tension has contributed to a sharp divergence between foreign and domestic institutional investors.
5. Institutional Divergence: FII Divestment vs. DII Accumulation
The final quarters of 2025 saw a significant 2.68% decrease in Foreign Institutional Investor (FII) holdings (falling from 18.34% to 15.66%). This exit was primarily driven by concerns over working capital and policy uncertainty. Conversely, Domestic Institutional Investors (DIIs) have maintained a “buy-the-dip” posture, bolstered by the company’s improved balance sheet.
Catalysts for Divestment and Divergence
- Working Capital Strain: Subsidy debtors surged sevenfold to ₹1,979 crores by December 2025, significantly stretching liquidity.
- Policy Uncertainty: Concerns regarding the December 2026 expiry of incentives for the Gadepan-III plant and the uncertainty of future “normalized return parameters.”
- Operational Headwinds: An unscheduled stoppage at Gadepan-I (stripper leak) and a major maintenance shutdown at Gadepan-II in early 2026.
- DII Stability Driver: Unlike FIIs, domestic funds have prioritized the company’s consolidated debt-free status (achieved in 2025) and its strategic pivot toward value-added projects like the Technical Ammonium Nitrate (TAN) plant.
Top Mutual Fund Holders (as of February 2026)
| Mutual Fund Name | Holding % (Feb 2026) | Holding % (Jan 2026) | Monthly Change |
| Kotak Nifty Chemicals ETF | 2.03% | 1.94% | +0.09% |
| Groww Nifty Chemicals ETF | 2.03% | 1.94% | +0.09% |
| DSP Nifty Smallcap 250 Quality 50 | 1.85% | 1.77% | +0.08% |
| Franklin India Dividend Yield Fund | 1.11% | 1.06% | +0.05% |
| HDFC Small Cap Fund | 1.06% | 1.02% | +0.04% |
6. Valuation Sensitivity: Projections and Market Realities
Navigating a volatile governance environment requires a clear understanding of the “valuation floor and ceiling.” The company’s historical inability to control expenses during periods of high revenue creates extreme price sensitivity.
Valuation Sensitivity: March 2025 Scenarios
| Metric | Best Case | Worst Case | Percentage Variance |
| Net Profit (₹ Cr) | 1,695.76 | 1,043.56 | ~38.5% |
| Earnings Per Share (EPS) | 42.33 | 26.05 | ~38.5% |
| Share Price (₹) | 482.05 | 234.22 | ~51.4% |
The Revenue/Profit Paradox The high variance between cases is rooted in the 2023 anomaly, where record sales of ₹27,772.81 Cr resulted in a decade-low Operating Profit Margin (OPM) of 6.56%. This occurred because expenses spiked to ₹25,950.66 Cr, nearly tripling YoY. If the company fails to manage “Extreme Expense Spikes” or experiences policy-driven EBITDA erosion, the share price floor of 234.22 becomes a statistical probability.
7. Governance Synthesis and Risk Profile
Chambal Fertilisers presents a strategic tension between its newly achieved debt-free status and escalating governance risks.
Institutional Risk Matrix
| Stability Drivers | Governance Risks |
| Birla Group Continuity: Long-term management stability and Birla Group backing. | Pledge Trends: Rising encumbrance (23.68%) creates systemic liquidation risks during volatility. |
| Debt-Free Status: Achieved consolidated debt-free status in 2025, providing a financial safety net. | Subsidy Volatility: Heavy reliance on government policy; subsidy debtors jumped to ₹1,979 Cr. |
| Price Upside: 12-month median target price of ₹515.5 indicates substantial recovery potential. | Tax Friction: Recurring penalties suggest “Aggressive Tax Accounting” and ongoing legal costs. |
Consultant’s Recommendation
The convergence of high promoter pledging and recurring tax litigation suggests that while the Birla Group provides a stability floor and the debt-free balance sheet is a formidable asset, the upside is capped by structural governance inefficiencies. The potential for debt-funded stake building indicates that the promoter’s “conviction” may be a leveraged maneuver to support the stock rather than a purely fundamental assessment.
Strategic Assessment: For institutional stakeholders, the risk-reward profile is skewed toward policy and expense sensitivity. While the 12-month target of ₹515.5 is attractive, investors should remain cautious until the promoter group demonstrates a clear trend toward deleveraging their pledged positions and resolving recurring tax frictions.