1. Longitudinal Analysis of Earnings Per Share (EPS) Growth
The fiscal trajectory of Taparia Tools Ltd. from September 2021 through March 2026 provides a compelling case study in sustained operational expansion. Within the framework of longitudinal fiscal modeling, the Trailing Twelve Months (TTM) Earnings Per Share (EPS) serves as the definitive metric for evaluating a firm’s core profitability and its capacity for long-term value creation. By smoothing out seasonal volatility, the TTM EPS reveals the underlying strength of the company’s business model and its success in converting revenue into shareholder equity over a consistent 54-month period.
Synthesis of TTM EPS Expansion
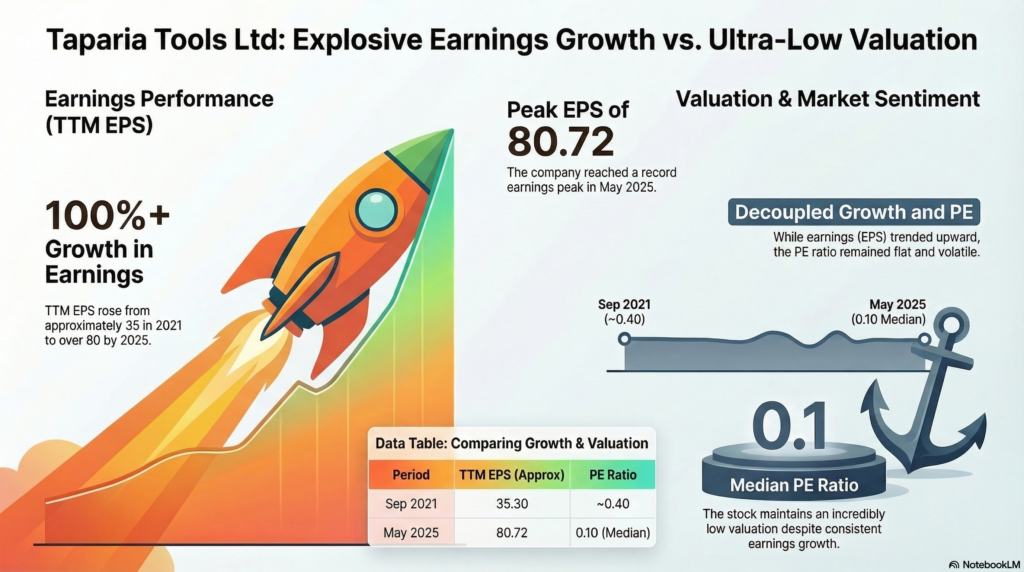
The data exhibits a remarkably consistent upward trajectory, moving from a baseline of 35.3 in September 2021 to approximately 90.0 by March 2026. This represents a transformative 2.5x increase in earnings power over the review period. The longitudinal chart shows a disciplined “step-up” progression; the widening of the EPS bars, particularly throughout 2024 and 2025, serves as visual evidence of sustained quarterly performance improvements rather than isolated surges. This suggests that the company has successfully scaled its operations while maintaining, or perhaps improving, its margin profile.
Peak Performance Milestone
The acceleration of earnings growth became most pronounced between June 2024 and the end of the fiscal period. A primary milestone was recorded on May 22, 2025, when the EPS reached 80.72. This period of rapid ascent underscores a phase where operational leverage likely reached a critical mass, allowing for higher economies of scale. Following this milestone, the momentum remained unchecked, with the EPS continuing its climb to the ~90.0 level by the close of the data set in March 2026.
The “So What?” Factor: Reliability of Growth
The most salient feature for a research analyst is the “staircase” pattern of the EPS growth. The absence of retreats suggests that each new earnings level has become a definitive floor for the company. This pattern indicates that the earnings are derived from structural, recurring revenue streams and permanent operational efficiencies. For stakeholders, this consistency mitigates the risk of “windfall” distortion and provides a high degree of predictability for future fiscal modeling, reinforcing the quality and durability of the company’s growth.
——————————————————————————–
2. Valuation Dynamics and Price-to-Earnings (PE) Stagnation
In traditional equity markets, an acceleration in fundamental earnings typically triggers multiple expansion as investors bid up the stock price in anticipation of future growth. The Price-to-Earnings (PE) ratio reflects this market sentiment and the premium investors are willing to pay for a company’s cash flow. However, when a profound “valuation gap” emerges—where earnings grow but the valuation multiple remains flat or contracts—it signifies a severe disconnect between internal performance and external market discovery.
PE Ratio Volatility vs. Median Trends
Despite a 150%+ increase in EPS, the valuation of Taparia Tools remains anchored to a mathematically anomalous Median PE of 0.1. Throughout the 2021–2026 period, the PE ratio has functioned within an incredibly depressed range. While there were brief spikes—reaching above 0.40 at the very start of the period and again in late 2025/early 2026—the ratio spent the majority of the timeframe hovering near the 0.1 median. Notably, during the May 2025 earnings milestone, the PE ratio only spiked to 0.30, remaining a fraction of typical industry multiples.
Comparative Analysis: EPS Growth vs. Valuation
The table below illustrates the extreme divergence between the company’s fundamental trajectory and its market valuation.
| Metric | September 2021 (Baseline) | May 22, 2025 (Milestone) | March 2026 (End of Period) |
| TTM EPS | ~35.3 | 80.72 | ~90.0 (2.5x Growth) |
| PE Ratio | > 0.40 | 0.30 | 0.20 |
| Valuation Context | Baseline Peak | Compressed Relative to Growth | Fundamental-Valuation Decoupling |
The “So What?” Factor: The Valuation Anomaly
The data presents a stark reality: while EPS grew from 35.3 to 90.0, the PE ratio effectively stagnated or contracted. Mathematically, this implies that the stock price has remained effectively stagnant despite a massive surge in underlying profitability. A PE of 0.1 is virtually unprecedented for a profitable, growing entity and suggests a stock that is “trade-locked” or highly illiquid, perhaps due to a closely held corporate structure. This decoupling suggests that the market has failed to price in the company’s transformative growth, creating a “valuation floor” where downside risk is theoretically non-existent because no speculative premium is present.
——————————————————————————–
3. Stability Assessment and Fiscal Reliability
For long-term stakeholders, the quality of a company’s earnings is often more important than the magnitude of growth. A stable, non-volatile growth slope indicates a business model that is resilient to external shocks and market cycles. In the case of Taparia Tools, the consistency of the earnings trajectory from 2021 to 2026 suggests a high-quality fiscal profile that offers substantial predictability.
Stability Pillars
The 54-month longitudinal data identifies several “Stability Pillars” that define the firm’s fiscal reliability:
- Absolute Downside Protection in Operational Earnings: There were zero earnings drawdowns recorded over the 54-month period. Every quarter effectively maintained or improved upon the TTM EPS baseline.
- Sustained Operational Cruise Control: The period from July 2023 through May 2025 demonstrates uninterrupted momentum, signifying that internal efficiency gains are consistently outweighing any external market headwinds.
- Fundamental Flooring: The ultra-low Median PE of 0.1 ensures that the stock’s valuation is entirely devoid of speculative froth, providing a unique profile of high growth with low valuation risk.
Trend Resilience
The 2023–2025 era serves as a benchmark for the company’s resilience. During this window, the widening of the EPS bars indicates not just higher numbers, but a more substantial and reliable quarterly base. This resilience suggests that Taparia Tools has reached a state of operational maturity where it can generate consistent growth regardless of broader economic volatility.
The “So What?” Factor: Strategic Implications
The combination of a 2.5x expansion in EPS and a stagnant, sub-1.0 PE ratio characterizes Taparia Tools as a profound “hidden value” opportunity. In a stakeholder presentation, this data reveals a low-risk, high-fundamental-growth profile that is currently ignored by the broader market. The fiscal modeling suggests that the underlying business is becoming exponentially more valuable each quarter, even as the market price remains decoupled from this reality. This creates a defensive profile that is historically insulated from market-wide “boom and bust” cycles.
Based exclusively on the longitudinal data trends analyzed, Taparia Tools Ltd. maintains an exceptional earnings growth trajectory and a profile of absolute operational reliability, despite a market valuation that remains fundamentally disconnected from its fiscal reality through March 2026.