1. Introduction: A Cracked Foundation or a Bold Rebound?
Nitco Ltd is a household name with a legacy stretching back to 1966, yet as we enter the 2026 fiscal year, the company stands as a glaring financial paradox. To the casual observer, the 50+ retail outlets and international footprint suggest a “tile giant” in its prime. However, a peek under the hood reveals a “capital incinerator” grappling with a staggering -42.87% Return on Capital Employed (ROCE) and a recent quarterly loss of ₹11.96 Cr.
How does a company with shrinking founder control and a decade of negative compounded sales growth (-10%) remain a major talking point for retail investors? The answer lies in a series of “statistical mirages” and a massive shift in who actually owns the company. As an analyst, my job is to look past the brand and interrogate the numbers that tell the real story of Nitco’s volatile transition.
2. The Great Escape: Promoters and Institutions Exit the Building
The most alarming trend at Nitco isn’t just the loss of profit; it is the mass exodus of “smart money.” Between March 2023 and December 2025, we witnessed a total transformation of the shareholding pattern that should give any retail investor pause.
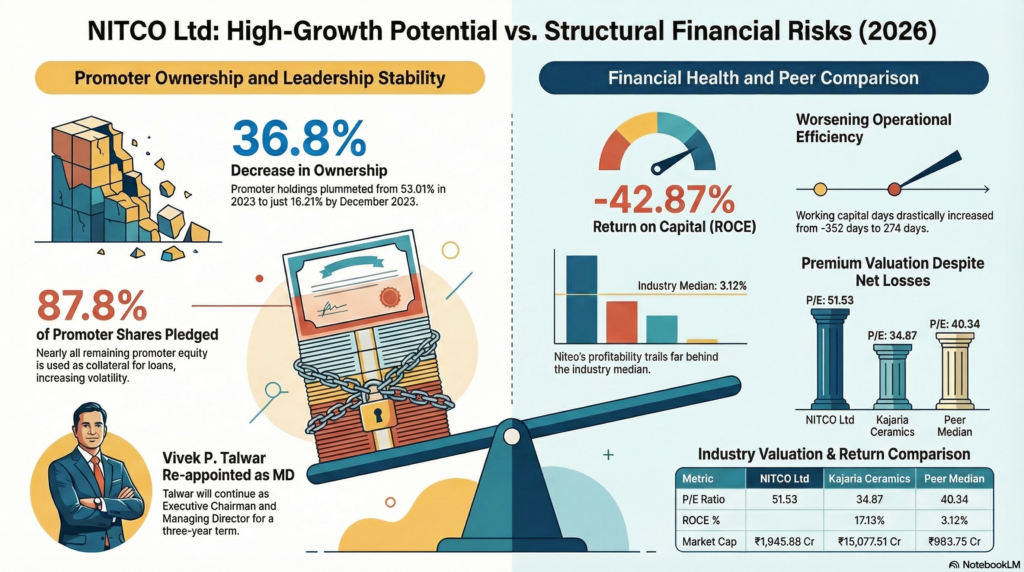
- Promoter Retreat: Ownership plummeted from 53.01% to a measly 16.21%—a 36.8% collapse in skin-in-the-game.
- Institutional Flight: Domestic Institutional Investors (DIIs) didn’t just trim their positions; they fled. DII holding cratered from 23.66% to just 1.68%.
- The Public “Bag-Holding”: As the pros left, the public stepped in. Public holding skyrocketed from 23.32% to 79.93%.
To make matters worse, of the tiny 16.21% stake the promoters have left, a massive 87.8% is pledged as collateral.
“This steep decline in ownership—coupled with the fact that most of the remaining shares are pledged—is flagged as one of the primary negative indicators for the stock.”
When the people running the company own so little (and have borrowed against most of that), the alignment between management and shareholders is virtually non-existent.
3. The Valuation Paradox: Paying a Premium for Losses
In a rational market, a loss-making company with negative returns should trade at a discount. Nitco, however, is priced like a high-growth tech darling. With a Market Cap of ₹1,945.88 Cr, Nitco is actually valued higher than its profitable competitor, Somany Ceramics (₹1,576.94 Cr).
| Metric | Nitco Ltd | Somany Ceramics | Kajaria Ceramics | Peer Median |
| Market Cap | ₹1,945.88 Cr | ₹1,576.94 Cr | ₹15,077.51 Cr | ₹993.75 Cr |
| P/E Ratio | 51.53 | 24.37 | 34.87 | 40.34 |
| Price to Book | 6.44 | (Not Listed) | (Not Listed) | — |
| ROCE | -42.87% | 11.51% | 17.13% | 3.12% |
| Net Profit (Qtr) | -₹11.96 Cr | ₹17.01 Cr | ₹86.15 Cr | ₹4.04 Cr |
Investors are currently paying 6.44 times the book value for a company that is consistently losing money. This suggests the market is either pricing in a miracle or ignoring the fundamental reality that Nitco’s valuation is detached from its operational performance.
4. The Operational Breakdown: A 626-Day Swing
Operational efficiency is the lifeblood of manufacturing, and Nitco’s cash cycle is in a state of total breakdown. The most startling figure is the swing in working capital days, which moved from -352 days to 274 days.
In its “negative” phase, Nitco was likely leaning heavily on its suppliers to fund its business—a common, if aggressive, tactic. The sudden shift to 274 days indicates that the cash conversion cycle has seized up. It now takes longer to collect from debtors (increasing from 62.3 to 74.8 days) and significantly longer to move inventory. When cash is trapped for nearly nine months in the cycle, the company is forced to rely on expensive borrowing just to keep the lights on.
5. Continuity Amidst the Storm: Reading the Section 185 Lines
Despite a five-year sales decline of -7.35%, Nitco’s leadership remains unchanged. Vivek P. Talwar has been re-appointed as Executive Chairman and MD for a three-year term starting April 1, 2026.
However, the “read between the lines” moment for investors lies in the Section 185 approvals passed alongside his re-appointment. Section 185 allows a company to provide loans or guarantees to entities in which the directors are interested. Given that the promoters have almost no skin in the game (16% holding) and have pledged nearly 88% of it, the authority to move capital toward “interested entities” raises significant corporate governance questions. Why double down on the same leadership that has overseen a decade of value destruction?
6. The Statistical Mirage: Growth on a Foundation of “Other Income”
At first glance, Nitco’s Trailing Twelve Months (TTM) performance looks like a rocket ship: 65.12% sales growth and 111.39% profit growth. But a senior analyst looks deeper.
- The Low Base Effect: These percentages look huge only because the previous years were so dismal.
- The Profit “Prop”: The TTM Net Profit of ₹34 Cr is a mirage. It is heavily propped up by ₹15.8 Cr in “Other Income” (non-core revenue) and a highly unusual negative depreciation figure of -₹5 Cr. Without these accounting quirks and non-core injections, the “profit” story evaporates.
- Debt Reduction Context: While debt fell from ₹973 Cr in March 2024 to ₹291 Cr in March 2025, this wasn’t driven by operations. The massive negative “Other Income” of -₹448 Cr in March 2025 suggests a one-time settlement or a massive asset sale was used to clean up the balance sheet.
Conclusion: The Future of the Tile King
Nitco enters 2026 in a state of profound identity crisis. It has successfully trimmed its debt, but at the cost of its founders’ and institutions’ confidence. We are left with a company where the “Public” owns 80% of the equity, the ROCE is deeply negative, and the “profit growth” is built on a foundation of other income and accounting adjustments.
Is Nitco a classic turnaround play where the market is correctly anticipating a return to glory under Vivek Talwar? Or is it the ultimate “value trap,” where retail investors are left holding the bag while the smart money has already cleared the room? As the 2026 fiscal year begins, the burden of proof lies entirely on management to prove that this is a rebound, not just a statistical mirage.